Analyzing Bitcoin Drip Patterns in BTCUSDT: Insights from 2021 to April 2025
Sukrit Sunama 7 months ago
In the volatile world of cryptocurrency trading, understanding price patterns can provide valuable insights for traders and analysts. A "Drip" in BTCUSDT is defined as a rapid price decline of at least 3% within a 6-to-48-hour window, with specific constraints on volatility in positive hourly candles (high-to-low not exceeding 2% in bullish candles). This analysis explores the characteristics, frequency, and behavior of Drips from January 2021 to April 2025, using hourly data to uncover patterns in their occurrence, size, and post-Drip price movements. We also examine technical indicators at the start and bottom of Drips to identify potential signals for traders.
Methodology
We used Python with libraries like Pandas, Matplotlib, Seaborn, and pandas_ta to process and analyze hourly BTCUSDT data. The Drip detection algorithm identifies events where the price drops by at least 3% from the closing price to the lowest price within 6 to 48 hours, ensuring no overlap with previous Drips and limiting volatility in positive candles. Key analyses include:
- Monthly and Yearly Distribution: Counting Drips and their average size by month and year.
- Technical Indicators: Calculating RSI (14-period), MACD (12, 26, 9), and Volume at the start and bottom (lowest price) of Drips.
- Post-Drip Returns: Measuring price changes (% returns) from the Drip low to 2–72 hours after.
Key Findings
Drip Characteristics
- Average Size and Duration: Drips have an average size of -3.91%, with a standard deviation of 1.11%. The average duration to reach the lowest point (the "bottom") is approximately 12.97 hours.
- Frequency: Around 464 Drips were detected from 2021 to April 2025, averaging about 100 Drips per year.
Monthly Distribution
Drips occur unevenly across months. January sees the highest number (60 Drips), while September (20) and October (19) have the fewest. This contrasts with prior analysis showing higher average hourly price increases in September and October.
The average Drip size remains relatively consistent across months, ranging from -3.69% (October) to -4.36% (May), suggesting that while frequency varies, the severity of Drips does not differ significantly.

A bar plot showing the number of Drips per month from January to December. January has the highest count (60 Drips), while September and October have the lowest (20 and 19, respectively). The plot uses a blue color palette with grid lines for clarity.
Yearly Trends
The number of Drips has decreased over time: 181 in 2021, 112 in 2022, 46 in 2023, 91 in 2024, and 34 in 2025 (up to April). This decline may reflect reduced market volatility as the crypto market matures, with participation shifting from tech enthusiasts to institutional investors and professional traders.
Note: Data for 2025 only covers January to April, as the analysis was conducted in late June 2025. Extrapolating the 34 Drips observed suggests a full-year count potentially 3–4 times higher, around 100–136 Drips.

A bar plot displaying the number of Drips per year from 2021 to 2025. The count decreases from 181 in 2021 to 34 in 2025 (partial year). The plot uses a blue color palette, with 2025’s lower count noted due to incomplete data.
Indicators at Drip Start
Predicting Drip onset is challenging. At the start of Drips
- RSI: Mean of 51.95 (median 52.80), indicating neutral momentum with no clear overbought (RSI > 70) or oversold (RSI < 30) signals.
- MACD: Mean of 8.94 (high variability, std 429.29), with MACD Histogram slightly positive (mean 12.49), suggesting no strong bearish momentum.
- Volume: Mean of 4082.23, with wide variability (std 6071.43), offering no consistent signal.
Histograms of these indicators show near-normal distributions, reinforcing their lack of predictive power for Drip initiation.

A histogram with a kernel density estimate (KDE) showing the distribution of RSI values at the start of Drips. The distribution is centered around 51.95, indicating neutral momentum. The plot uses 30 bins and includes grid lines.
Indicators at Drip Bottom
At the Drip’s lowest point, indicators provide clearer signals:
- RSI: Mean of 34.42 (median 34.42), close to the oversold threshold (RSI < 30). This aligns with a prior analysis of Drips defined at 5%, suggesting RSI reliability at lower timeframes (e.g., 5-minute) for identifying reversal points.
- MACD: Mean of -284.10, with a negative MACD Histogram (mean -135.62), indicating strong bearish momentum at the bottom.
- Volume: Mean of 8604.10 (higher than at start, 4082.23), suggesting increased trading activity as prices hit the low. These findings imply that the Drip bottom is a potential reversal zone, particularly when RSI approaches oversold levels.

A boxplot showing the distribution of RSI values at the Drip bottom. The median RSI is 34.42, with the interquartile range between 27.21 and 41.26, indicating proximity to oversold levels. Outliers are visible, with a minimum of 5.56 and a maximum of 72.32.
Post-Drip Price Movements
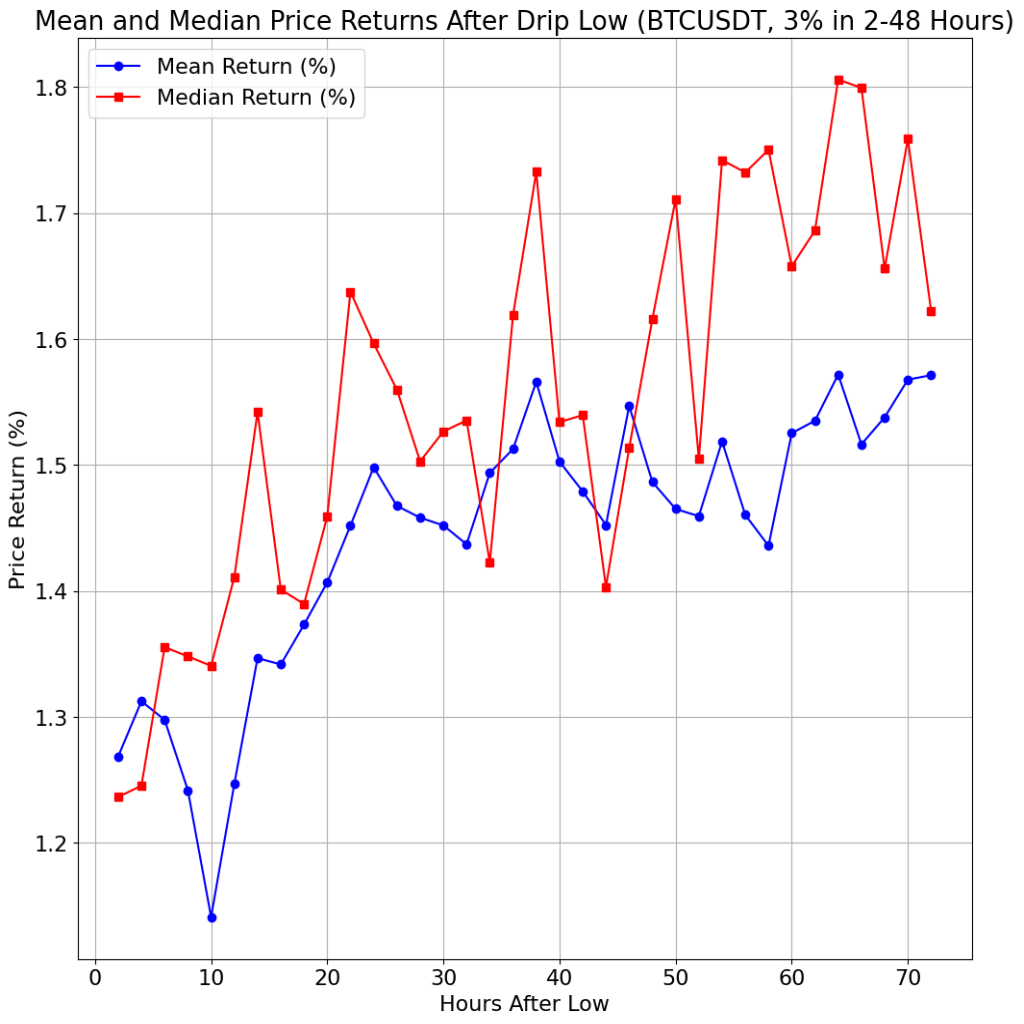
After reaching the Drip bottom, prices tend to recover: Average returns are positive across all timeframes (2–72 hours), ranging from 1.24% (8 hours) to 1.57% (72 hours).
Median returns are also positive, peaking at 1.81% (64 hours), indicating that most Drips are followed by upward movements.
Boxplots show a wide range of returns (e.g., -24.84% to 26.89% at 54 hours), but the interquartile range (25th to 75th percentile) remains positive, suggesting a higher likelihood of gains.
Unlike Moonshot events, where post-peak price drops are less predictable, Drip bottoms offer a clearer opportunity for short-term gains, as buying at the low and selling quickly has a high probability of profitability.

A boxplot showing the distribution of price returns (% change from Drip low to close price) across 2–72 hours after the Drip bottom. Each box represents a 2-hour increment, with positive median returns (1.24–1.81%) and a wide range of outliers, indicating volatility but a positive bias.

A line plot showing the mean (blue) and median (red) price returns after the Drip bottom over 2–72 hours. Both metrics remain positive, with means around 1.24–1.57% and medians peaking at 1.81%, suggesting consistent recovery trends.
Implications for Traders
The analysis suggests that Drip bottoms, marked by RSI around 34.42 and elevated volume, are potential entry points for short-term trades. The positive post-Drip returns (1.24–1.57% on average) indicate a high probability of price recovery within 2–72 hours. However, the neutral indicators at Drip onset make it difficult to anticipate these events, requiring traders to focus on real-time monitoring of RSI and volume for reversal signals.
Limitations
- The 2025 data only covers January to April, likely underestimating the full-year Drip count.
- The analysis uses hourly data, which may miss finer reversal signals on lower timeframes (e.g., 5-minute).
- External factors like market news or macroeconomic events are not considered, potentially influencing Drip frequency and size.
Conclusion
Bitcoin Drips offer a fascinating lens into market dynamics, with an average decline of 3.91% over 12.97 hours and a yearly frequency of about 100 events. While their onset is hard to predict, the bottoms provide actionable signals, particularly with RSI near 34.42 and high volume. Post-Drip recoveries are common, making these events attractive for short-term trading strategies. As the crypto market evolves, the declining Drip frequency reflects a maturing ecosystem, but opportunities for savvy traders remain.
Disclaimer: This analysis is for informational purposes only and does not constitute investment advice. Trading cryptocurrencies involves significant risk, and past performance is not indicative of future results.
Code and Data: The full code and analysis are available on GitHub.